


Table of contents
Introduction
Deploying a system in production and ensuring its smooth operation is our primary goal. However, several questions often arise:
When might it go down?
Are our databases in good condition?
Are our microservices performing well?
How is communication with external systems?
What about traffic?
How many queries do we handle daily?
How efficiently is our system being utilized?
Monitoring
Two fundamental concepts can help answer these questions: Monitoring and Observability.
Infrastructure Monitoring involves collecting health and performance data from servers, virtual machines, containers, databases, and other backend components in a tech stack. Engineers use monitoring tools to visualize, analyze, and set alerts on metrics to understand whether any backend issues are affecting users.
Observability is the degree to which you can comprehend the internal state of a complex system based solely on knowledge of its external outputs. It focuses on understanding the internal state of systems based on the data they produce, aiding in determining the health of your infrastructure.

In our system, various components work together to provide a seamless service to users, producing a multitude of data through different protocols and between various systems.
Prometheus is a core technology for monitoring and observability. It collects, stores, and queries system metrics into a time-series database, allowing for effective system monitoring.
Grafana Open Source is a visualization and analytics tool that enables querying, visualizing, alerting, and exploring metrics, logs, and traces, regardless of where they are stored. It provides tools to transform time-series database (TSDB) data into insightful graphs and visualizations.

Prometheus architecture(https://prometheus.io/docs/introduction/overview/)
Our system comprises the following components:
MongoDB: This serves as our database under surveillance.
MongoDB Exporter: Utilized to sniff and extract changes in MongoDB, acting as our information gateway.
Prometheus: Actively listens to MongoDB Exporter, staying informed about any changes and storing this data for analysis.
Grafana Open Source: Serves as the visualization tool, providing an intuitive interface to monitor and analyze the stored data.
To illustrate the interaction between these components, refer to the graph below:
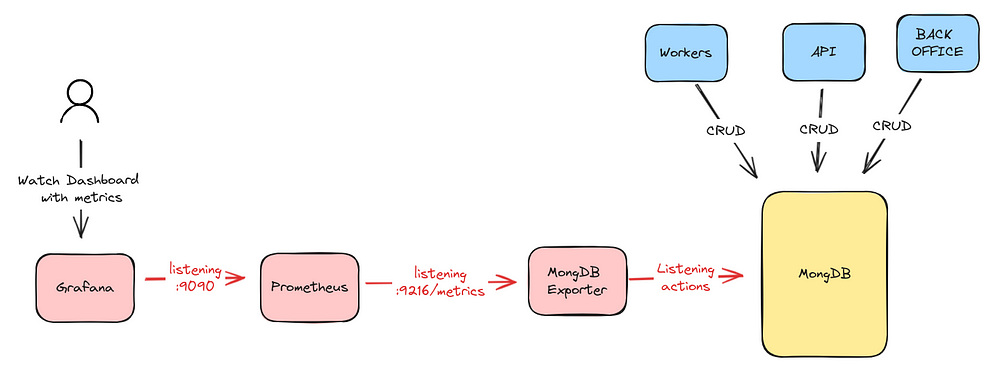
This simple setup above allows us to effectively monitor MongoDB, track changes, and visualize the data through Grafana.
For our implementation, we’ll use Docker and Docker Compose to build a local architecture. Below the docker-compose.yml

Let us configure Prometheus to listen to these changes and write them to its time-series database :

prometheus.yml
Configure Grafana Open Source to visualize this data using Percona, which is well-suited for this purpose.
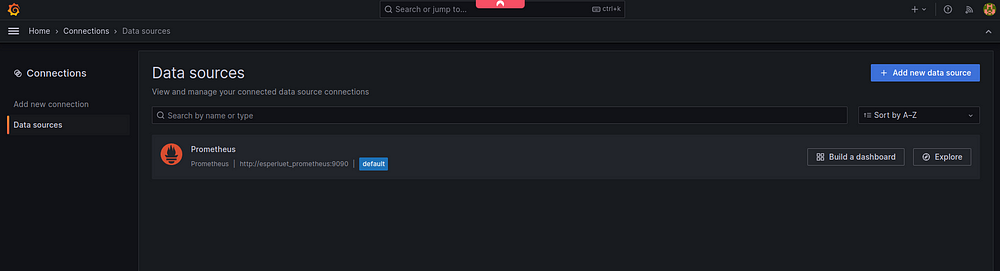
Below are some steps to configure Grafana by adding Prometheus as a data source
- Add a new data source:https://prometheus.io/docs/visualization/grafana/#creating-a-prometheus-data-source

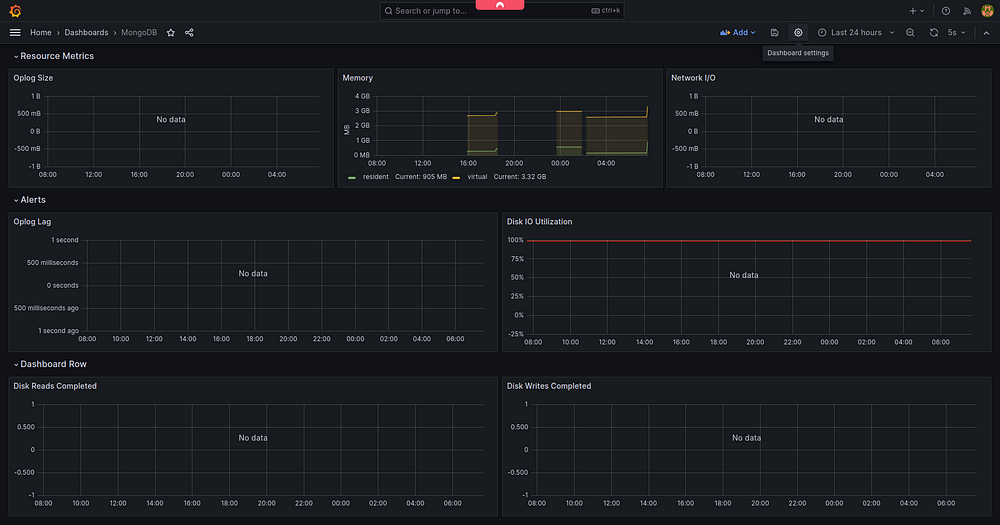
- Create a new dashboard: just import an existing one https://grafana.com/grafana/dashboards/?search=mongo
Here are a graph of the created MongoDB dashboard :

Here is the GitHub repository of the project, you can test it locally: https://github.com/Lionelsan95/prometheus_grafana_monitoring
Conclusion
Monitoring and observability are crucial aspects of a system’s health. They play significant roles in different business domains, including IT, DevOps, and SRE. Prometheus and Grafana are valuable tools in this realm, and we will introduce other tools in the future.